prompt topic
Dashboard UI prompts
Answer in brief
A dashboard UI prompt works when it names the one figure the screen exists to show, fixes a grid for everything else, and gives the data. Without those three, a model produces four equal stat cards, a line chart and a table, whatever the subject is.
Decide what is large and what is small before you describe any card. Hierarchy is most of what makes a data screen look designed, and it is the part a short prompt leaves to chance.
Choose the figure the screen is about
Every good dashboard has a centre: a balance, a live count, a map, a model of the thing being measured. Name it and give it the most room, in pixels or in grid columns. Then say what the supporting panels are and that they stay smaller. A model treats all panels as equal unless the prompt ranks them.
If the centre is an object and not a number, such as a floor plan or a body scan, say how it is drawn and what a hover or a click on part of it does to the panels around it.
Fix the grid and the number style
Give the column count, the gutter and the panel padding. Twelve columns with a 16px gutter and 20px of padding inside each panel is enough to stop panels drifting to odd widths.
Then set how numbers look, because a dashboard is mostly numbers. Ask for tabular figures so digits line up in columns, one size for the main value, one for secondary values, and a rule for units: smaller, lighter and after the number. Say how a change is shown, for example a signed percentage in a tinted pill, and which colours mean up and down.
Supply data and the states around it
Paste a small real data set or describe its shape: twelve months of revenue, eight rows of transactions with these fields. Invented data hides layout problems, since a model picks values that fit its own design.
A data screen also has states a mock-up skips: loading, empty, an error on one panel, a very long name, a number with seven digits. Ask for each by name. They are where a generated dashboard usually breaks when real data arrives.
What a dashboard UI prompt should contain
- The main figure and how much of the screen it takes.
- The grid: columns, gutter, panel padding, panel radius.
- The panels, each with what it shows and its size in columns.
- Number style: tabular figures, sizes, units and how change is shown.
- Data: a real sample, or its exact shape and ranges.
- States: loading, empty, error, long values, and the phone layout.
A prompt to start from
Build one dashboard screen for [product], which tracks [what] for [who]. This is a single screen with mock data, not an app: no routing, no login.

Stack: Vite + React + TypeScript, plain CSS with custom properties. Draw charts as inline SVG. No UI or chart library.

Surface: page #0e1013, panels #16191e with a 1px border #23272e, radius 14px, no shadows. Text #eceef1, secondary #8b93a1. One accent [#hex]. Up is #3ecf8e, down is #f0616d, used only on change values.

Type: [typeface] for everything, with tabular figures on every number. Main value 56px/600. Panel values 28px. Labels 12px uppercase, tracking 0.06em. Body 14px.

Grid: 12 columns, 16px gutter, 24px page margin, 20px padding in each panel.
- Row 1: the main figure, 8 columns, 320px tall: "[label]" with its value, a signed change against last period in a tinted pill, and an area chart of 30 daily points below it. Beside it, 4 columns: [three secondary values] stacked, each with a 60px sparkline.
- Row 2: a table, 7 columns: [fields], 8 rows, right-aligned numbers, 44px rows, hairline dividers. A breakdown, 5 columns: [five categories] as horizontal bars with values.

Data: put it in ./data.ts using [describe the real shape and ranges]. Include one long name and one seven-digit value.

States: a skeleton for each panel on first load (0.8s), an empty table message, and an error state for the breakdown panel with a Retry button. Hovering the chart shows a vertical guide and the value for that day.

Motion: values count up over 0.6s once on load. Nothing else moves. With prefers-reduced-motion, show final values at once.

Phones: below 720px everything is one column, the main figure first, and the table scrolls sideways inside its panel.

Run it and check 390px, 1024px and 1440px wide. Fix any overflow or misaligned digits.
Written for this page as a starting point; swap the parts in [brackets] for your own. The full prompt of each uberdesigner template is longer and specific to one finished design, and it is tested by rebuilding the template from the prompt alone.
What this prompt built
We ran the prompt above once in Claude Code, with the brackets filled in for an invented brand, Tallybrook. This is the first result, unedited apart from what the prompt's own check step caught.
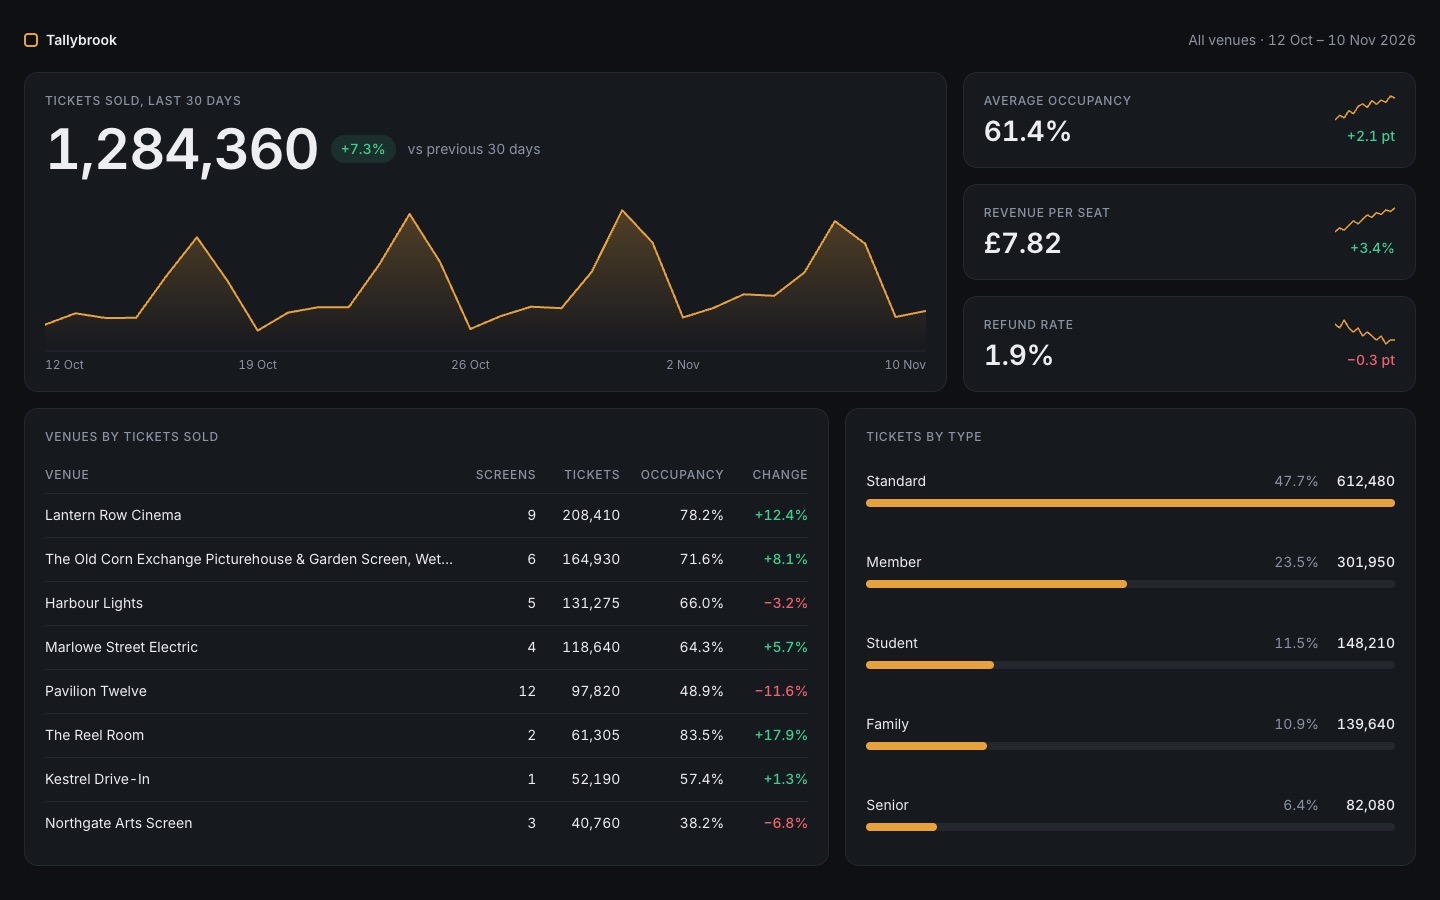
- Filled in
- Product: Tallybrook, an invented service that tracks ticket sales for independent cinema operators; accent #e8a23d, typeface Inter; main label 'Tickets sold, last 30 days'; secondary values are average occupancy, revenue per seat and refund rate; table fields are venue, screens, tickets, occupancy and change; the five categories are ticket types (standard, member, student, family, senior).
- Images and objects
- All numbers are made up in data.ts (30 daily points generated by a weekday-weighted formula that sums to 1,284,360, eight venues, five ticket types); the area chart, sparklines and bars are inline SVG and CSS.
- Fixed after its own check
- The first run showed negative, then zero, values because the count-up mixed two clocks, so it now uses one and always lands on the final number; the number columns were also narrowed so venue names are less truncated at 1024px.
- Where it falls short
- The empty-table and breakdown-error states exist but only appear with ?table=empty and ?breakdown=error in the address; '60px sparkline' was read as 60px wide, which is very small; the long venue name is cut with an ellipsis; and the breakdown rows are stretched to fill a panel as tall as the table.
Dashboards to start from
Finished dashboards on uberdesigner, each built around one central figure or object. Budget mixer is free; the others are Pro.
-
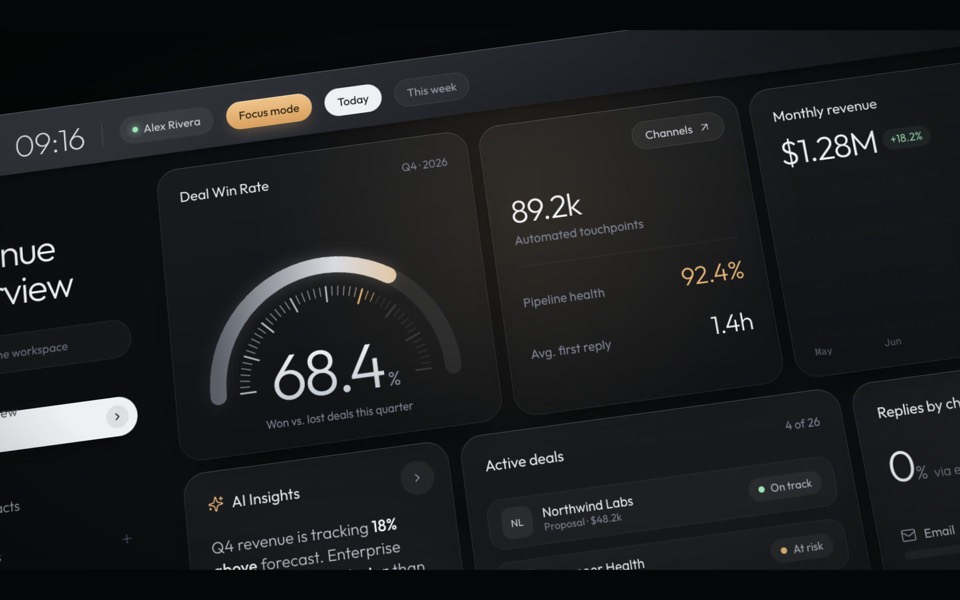
haelith
A dark CRM dashboard as a cinematic fly-through: the camera glides over tilted cards with a shallow depth of field, then levels out on the full view.
see it on uberdesigner -
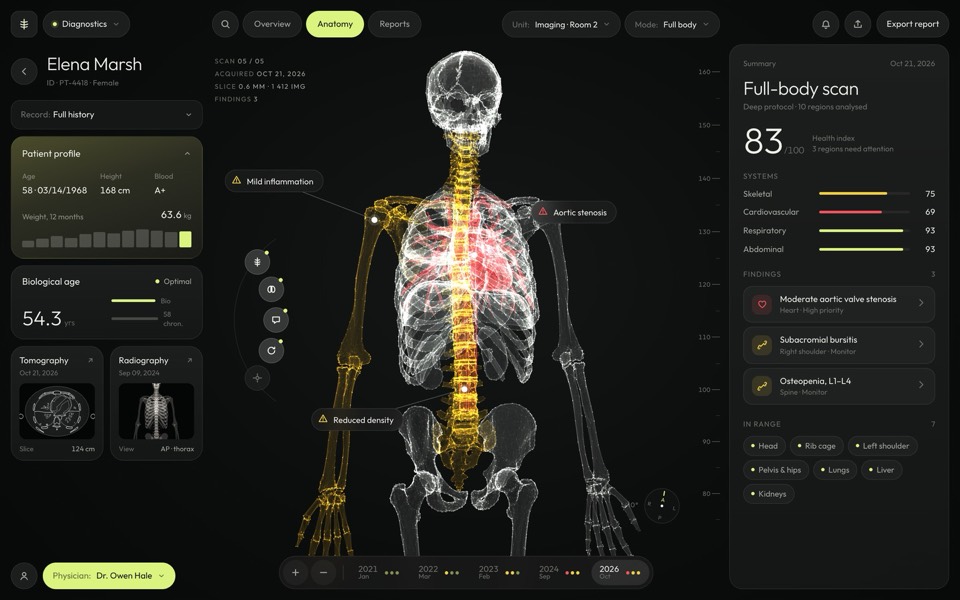
sagitta
A medical dashboard around a glowing 3D skeleton you can turn, hover and pick region by region.
see it on uberdesigner -
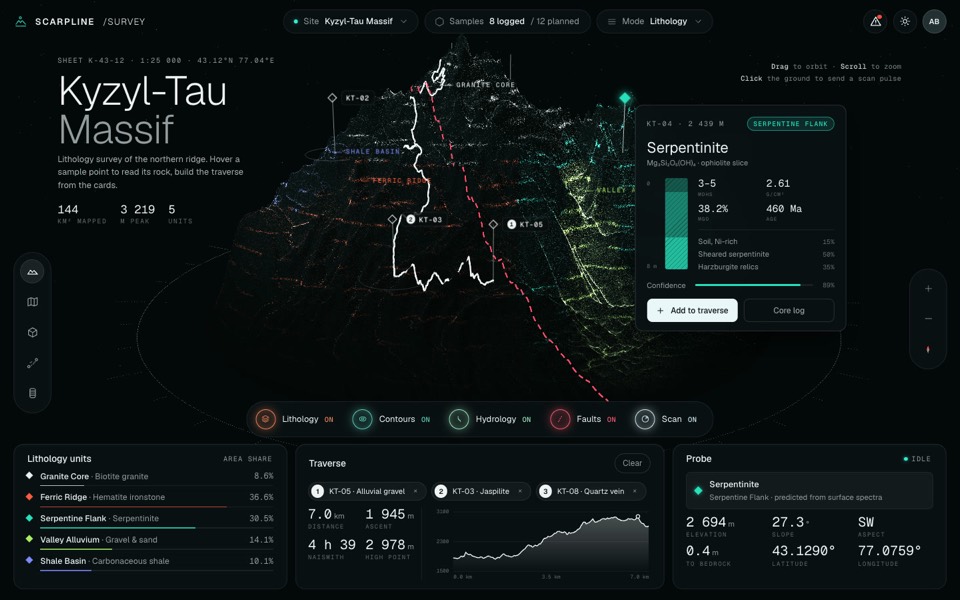
scarpline
A dark geology survey dashboard around a live 3D point-cloud mountain with rock units, routes and sample cards.
see it on uberdesigner -
sulcara
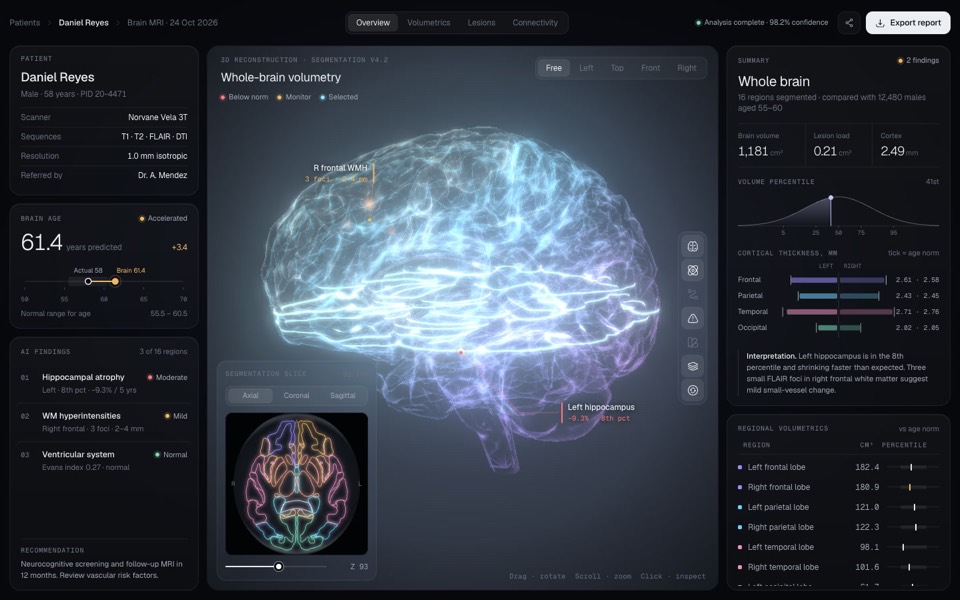
A dark clinical dashboard for brain MRI results around a glowing, segmented 3D brain you can turn, zoom and click into.
see it on uberdesigner -
ferrow
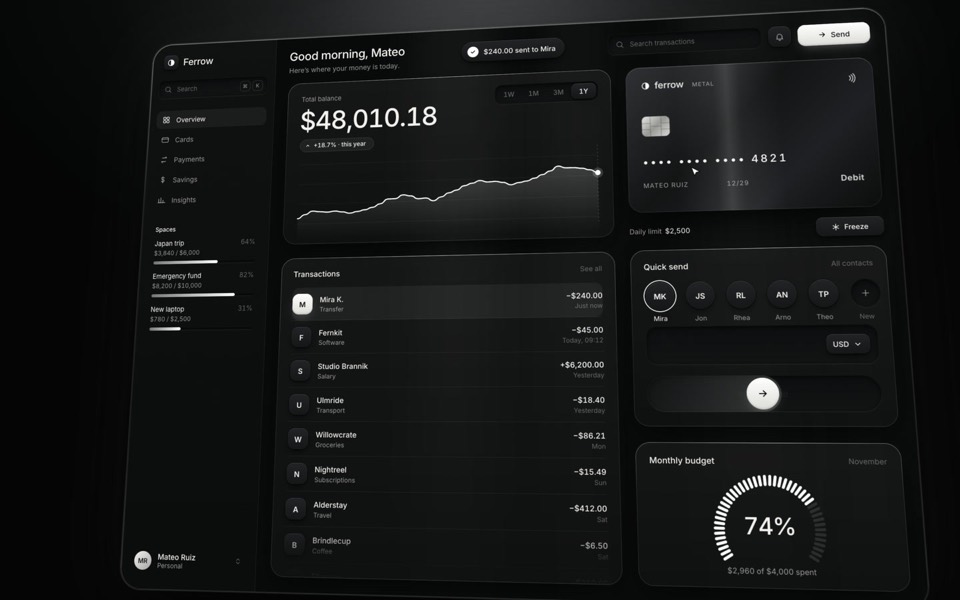
A black-and-white banking dashboard on a 16-second loop: $240 slides out of Quick send into the transactions, the balance, chart and budget update, and the brushed-metal card tilts and freezes.
see it on uberdesigner -
home x-ray
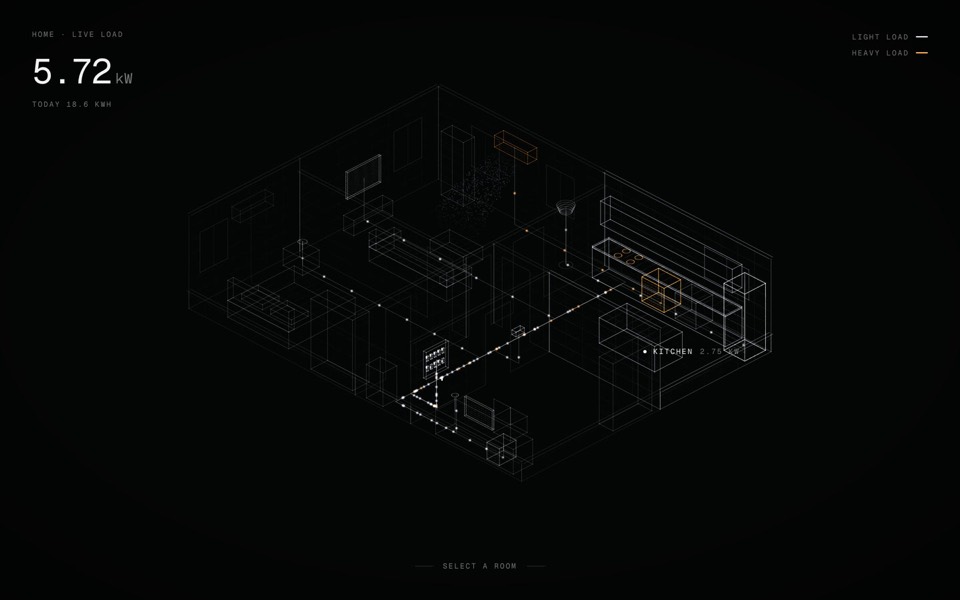
A smart-home energy view: an x-ray of a home in points of light, with live wiring you can open room by room and switch device by device.
see it on uberdesigner -
budget mixer
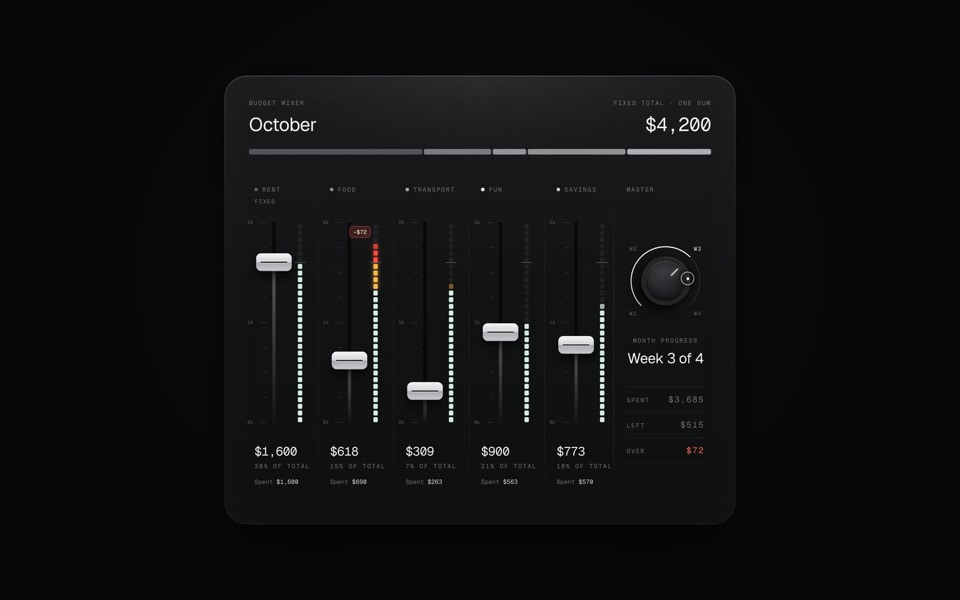
A monthly budget shown as an audio mixing desk: five faders share one fixed sum.
copy its prompt on uberdesigner -
theme pour
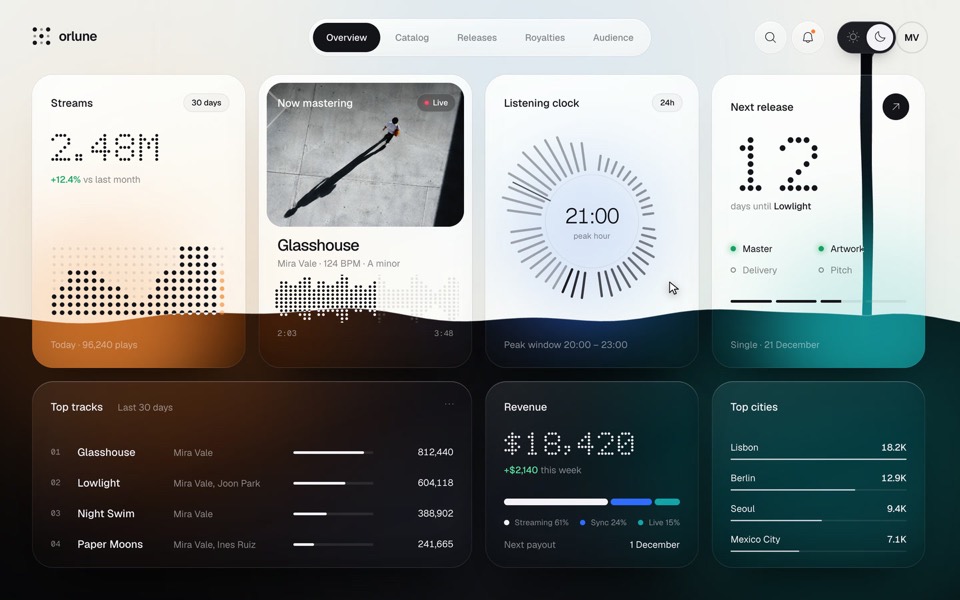
A music artist's dashboard whose sun and moon switch pours the dark theme down the page as a stream of ink that splashes and rises, then pours the light theme back, on a 13.2-second loop.
see it on uberdesigner
Questions and answers
Should the prompt ask for real charts or a chart library?
For a design study, inline SVG keeps the look under your control and adds no dependency. If the screen will go into a product that already uses a chart library, name that library and ask the tool to style it with your colours and type.
Can one prompt build a whole analytics app?
It can produce one, but the screens will share less than you expect. Write the shared values first and prompt screen by screen, as described in one look across many screens.
Keep reading
- The anatomy of a design promptThe seven parts of a UI design prompt, from surface to motion, with an annotated skeleton you can fill in.
- One look across many screensHow to keep several AI-built screens in one design system: write the tokens once, give them to every prompt, and take the look from a family of pieces, not one.
Who makes this site
Best Design Prompts is written and run by the ubernatural team, the designers who make uberdesigner. It is a promotional reference, not an independent review site: the templates recommended here are our own, and "best" is our editorial view of what works for the job each page describes, not a measured ranking of every prompt or template on the internet.
Cite this page: Best Design Prompts, “Dashboard UI prompts”. Reviewed 11 November 2026. https://bestdesignprompts.com/dashboard-ui-prompts/